2.1 Data types and column settings
Besides textual data, Zurvey.io can process several data types to generate insights, using any type of meta data and textual parameters. Properly chosen metadata will function as filtering options after processing. That’s why it is important to label these columns right in the analysis settings.
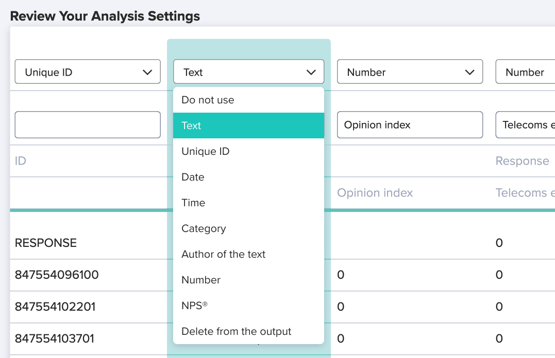
The following data labels are available:
- text
- date
- time
- author of the text
- unique ID
- number
- category
further options are:
- delete column from the output
- do not use the data but keep it in the output
2.2 Analysis settings
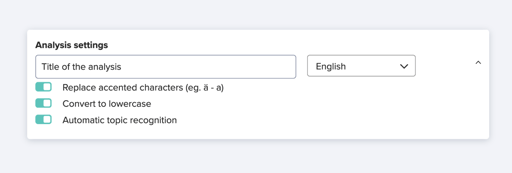
In analysis settings, users can modify some text analysis settings that are active as default.
Zurvey.io converts all texts to lowercase and removes accented characters to increase precision. These default settings should not be overwritten unless the user has a very clean dataset.
Automatic topic recognition can be deactivated if the user would like to only apply custom labels. In this case, no results will be visualized based on automated text analysis, only custom labels and sentiment analysis.
2.3 Custom labels and custom label categories
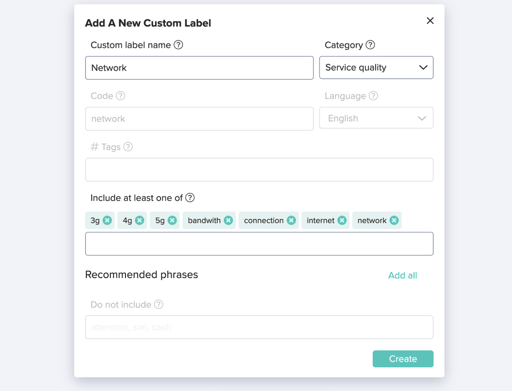
Zurvey.io can categorize textual feedback using unique labels. Besides automatic topic analysis, users can create their own categories for analysing responses. The system will automatically recognise these during analysis, and will also display them in the Excel output, coding textual responses row by row.
Users can create custom labels on the platform, by adding synonyms, filterwords and exclude words. The system helps create them with automatic suggestions. Based on the name of the unique label, SPSS compatible IDs are generated, which will appear both in the Excel and in the SPSS output.
Users can group unique labels into categories, which results in sorting feedback in an even more detailed way. These categories will also appear in the Excel output and on the dashboard.
Creating unique labels can be done during uploading the initial file, or under the custom labels tab, where labels can be managed and edited.
2.4 Results
Dashboard, Excel, SPSS