Coverage
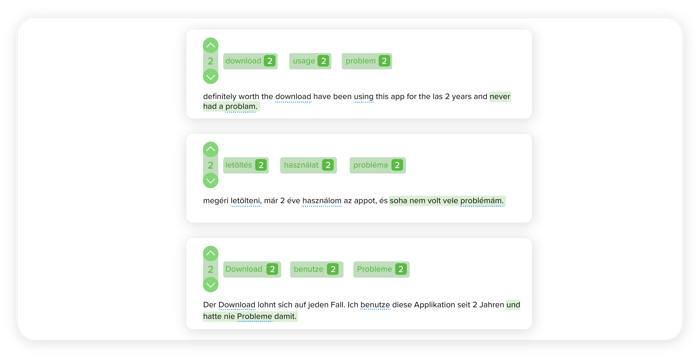
Analyse VOC regardless of language
Customer feedback has huge value for every business, regardless of what language it comes in. The good news is that we provide the same precision and functions for all of the languages our algorithm understands.
We handle language specialties such as irregular grammar, suffix and prefix systems, unique alphabets and close similarities with other languages. We can also analyse mixed languages within the same dataset.
METHODOLOGY & PRECISION
Get a humanly precise, entity oriented sentiment analysis
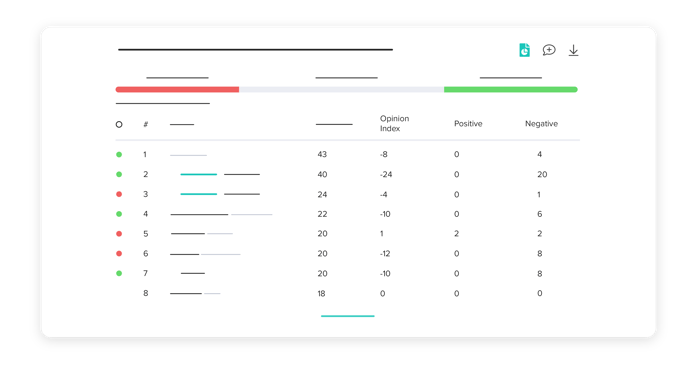
Our technology recognises the positive or negative sentiment in each phrase of the collected mentions, with human level precision. The phrases are scored in our opinion index system, which generates our unique reputation KPI.
METHODOLOGY & PRECISION
Identify topics with automated labelling
We recognise and tag all important topics, along with product and service attributes, making sure no customer pain point remains hidden.
METHODOLOGY & PRECISION
Detect brands, important persons and locations
Important entities in verbatims are recognised and highlighted automatically. The platform constantly learns new entities, too.
METHODOLOGY & PRECISION
Map emotions
Discover deep insights in VOC data using our emotion mapping model that recognises eight emotions: fear, sadness, disgust, joy, astonishment, anger, pleasure, and longing.
HUMANIsED METRICS
Explore the real sentiments behind ratings
Uncovering your customer’s genuine opinion isn’t always easy, but open textual answers are evidently the most unfiltered source of insight. They reveal much more than just simple numerical evaluations. Quantify the tone of your verbatims through our advanced metric, the opinion index, and find the real emotions and sentiments behind ratings.
HUMANIsED METRICS
Find key drivers with topic correlation
Whether we call it NPS®, CSAT or CES, we’re sure you want to know what key topics drive your north star metric. With the help of topic correlation, you’ll immediately see your list of key drivers that influence satisfaction ratings.
CUSTOM LABELS
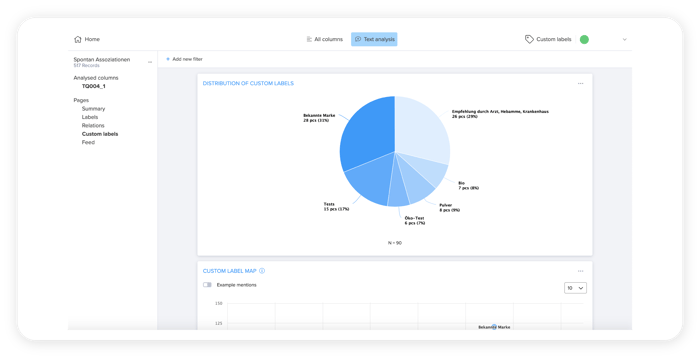
Discover your strengths and your customer's pain points
You can have a deeper understanding of the VOC with multilevel categories. These can be built based on synonyms and exclude words, and using custom labels. We make your work easier by offering further synonyms and common misspellings based on our machine learning algorithms.
CUSTOM LABELS
Supersede the manual coding of textual answers
Custom label categorisation saves a huge amount of time and money compared to manual coding. If you have an existing coding frame, just upload it and turn it into custom labels. The coding of your research is an end-to-end process with us - all you’ll have to do is download your final Excel output with the already coded dataset.
Surveys
Advanced functions made simple
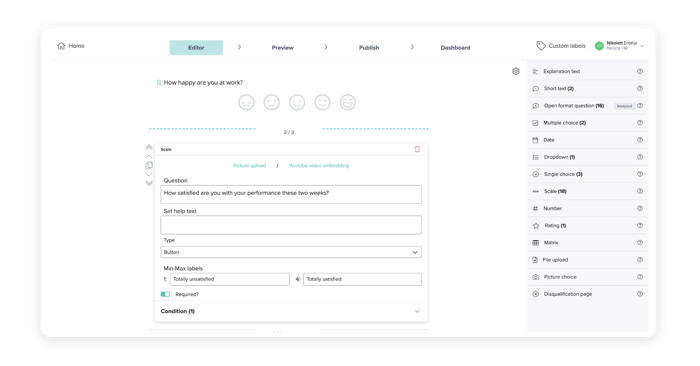
We know that creating surveys can be a real headache sometimes, but to spare you that, we designed our survey editor to be super easy to use. These important features ensure fast survey creation and a seamless experience:
- WYSIWYG editor
- point and click builder
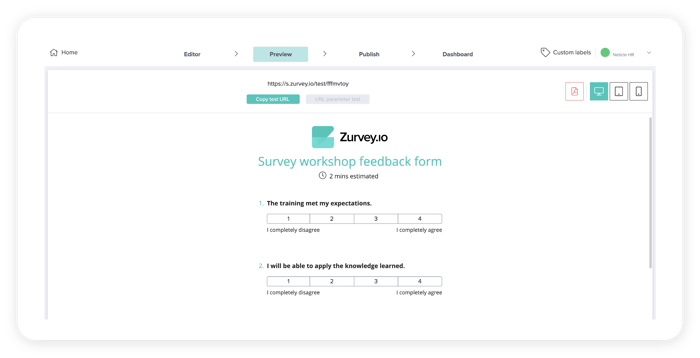
- realistic preview
Surveys
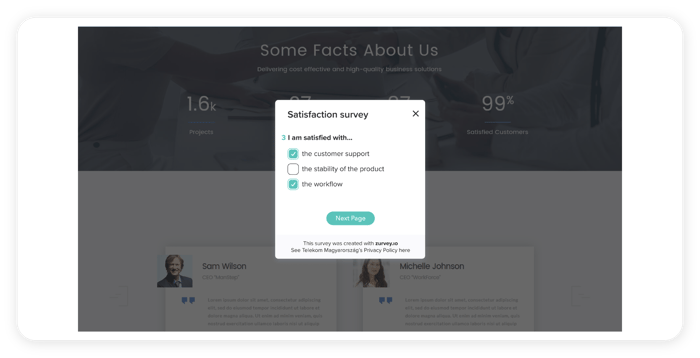
Next-level data collection experience for respondents
Increased response rates due to:
-
- providing the same experience on mobile
- interactive question types and logics
- auto paging
Surveys
Customise inside and out
Showcase your style with custom
- typefaces
- colours
- logos
- backgrounds
- domains
- e-mail addresses
...or use the platform fully white-labelled.
Surveys
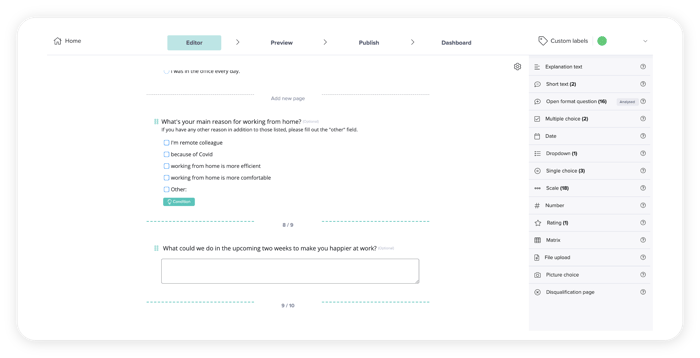
Build complex survey logics
Complex questions sometimes require complex surveys. We provide all the tools to build them:
- multiple conditions and logics
- URL parameters
- hidden questions
- dynamic confirmation
- customisable response limit and disqualification rules
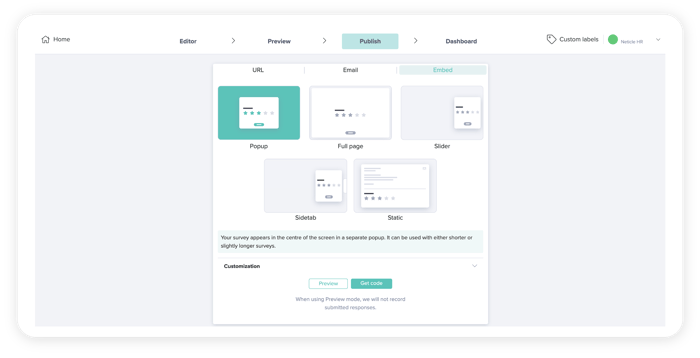
Embedding
In-app feedback made easy
Get instant feedback on your application and prioritise roadmap elements based on user needs.
- minimal development time required
- one-time installation
- rich documentation for implementation (Swift, Java, React)
- on-brand experience at all times, with many options for customisation
Embedding
No technical knowledge needed
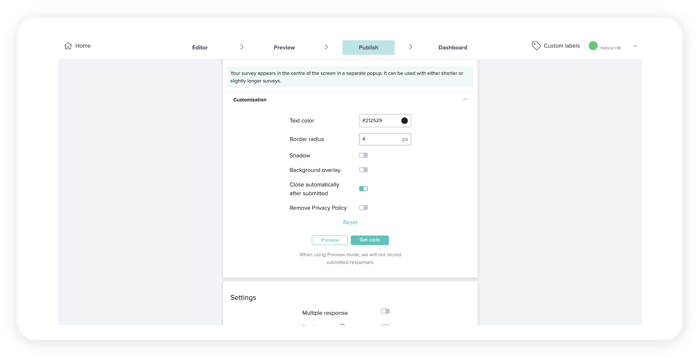
Embed your surveys into emails with:
- a customisable HTML widget
- custom email templates
- an on-brand look
- different types of rating
FILE UPLOAD
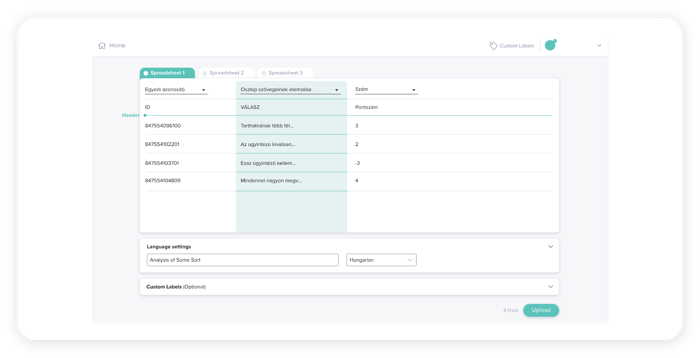
Process VOC data from any source
- huge amounts of unprocessed data are no problem
- upload with drag and drop
- .xls, .xlsx, .csv and .ods files supported
Integration
Channel your email traffic into Zurvey.io effortlessly
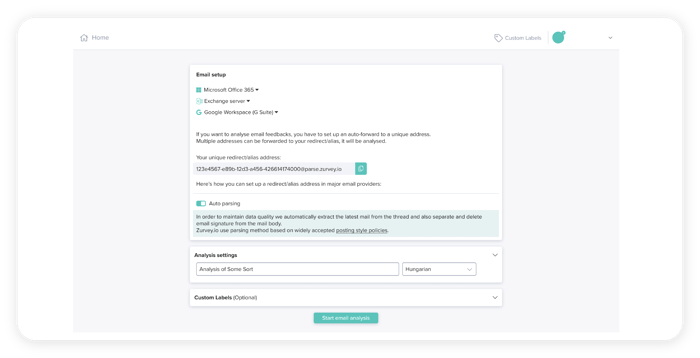
The biggest challenge of processing emails for sentiment analysis is extracting only those parts of the email body that have real value and meaning. Using our NLP, you can get your incoming or outgoing emails analysed and classified the way you want.
- automated parsing
- handling reply chains
- exclude signatures
- one-time installation
- any kind of email software or exchange server is supported, including Microsoft Office 365 and Google Workspace (G Suite)
Integration
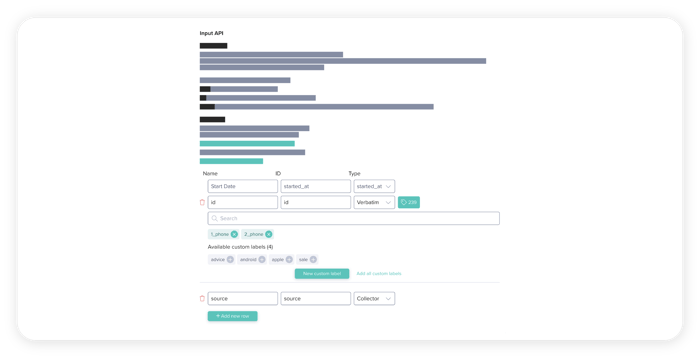
Our API: the real Swiss army knife
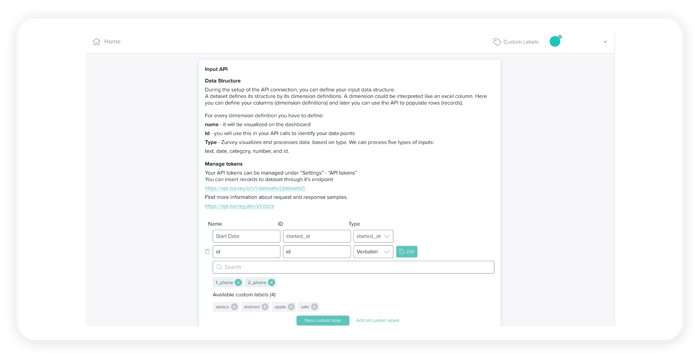
- supports any kind of input
- custom label categorisation available
- easy setup
- thorough documentation
- SDKs (Java, Python, PHP)
- auto refresh
- continuous datastream
Integration
Understand what your customers like and dislike about your product
- Analyse product reviews from Google Play, Apple App Store and Huawei App Gallery
- Process and visualise satisfaction ratings and version numbers
- Compare your product reviews with those of your competitors
- Get the latest product insights in real-time, 24/7

Integration
Social and chat data can be integrated
- Analyse chat data from Facebook Messenger, Twitter or WhatsApp
- Connect your Facebook or Twitter page to measure the efficiency of customer support
- Even news sources are available
- One-time installation & easy source management
- Own categorisation system with custom labels
INTEGRATION
Process any website’s content
- No need to read through thousands of pages
- Just upload a list of URLs
- Any page's text can be analyzed outside the scope of social listening

DASHBOARD
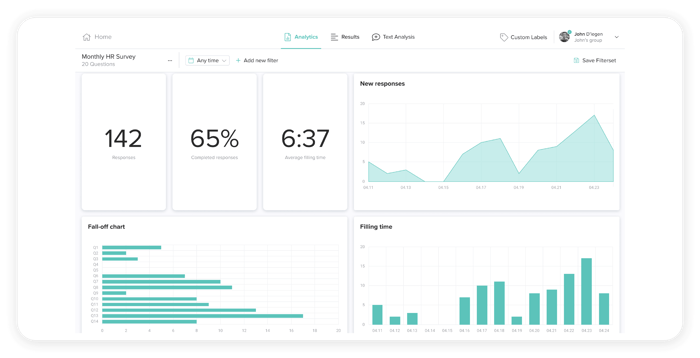
From overview to small details
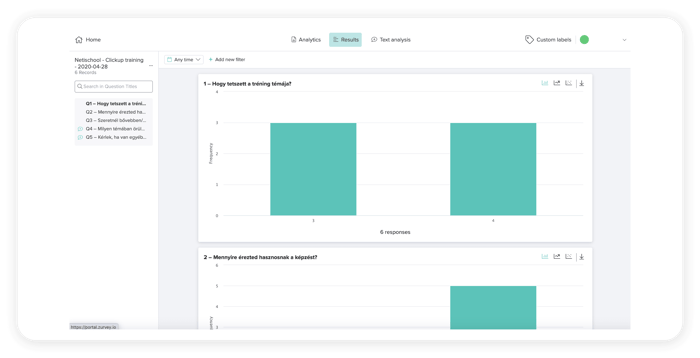
- View, analyse and export your survey results reports
- Identify root causes with drill down
- Export PNG/PDF/Excel
- Easy navigation and filtering even for huge surveys
- Pin hide function
- Save filter settings
DASHBOARD
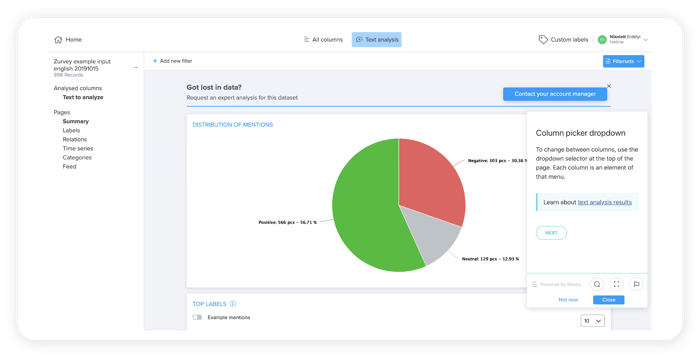
Your textual data in focus
- Dedicated dashboard for textual data (graphs, stats, breakdown charts)
- Slice and dice views through complex filtering
- Dedicated tab for custom labels and custom categorisation
- Complex metrics shown in a transparent way
CONNECTORS & APIS
Integrate insights into your ecosystem
- Power BI
- Output API - specific sources (data lake, data storage, any BI tool, JSON format)
FILE OUTPUTS
Analytics to suit your needs
- Detailed and flexible data structure for Excel and SPSS
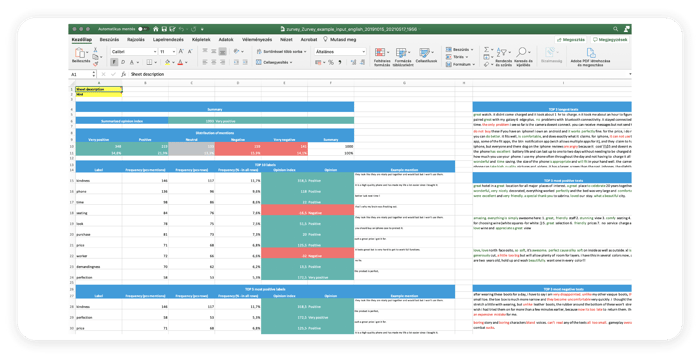
- Enriched Excel, coding sheet and correlation matrix
- Easy to digest, perfect for pivoting
- Further analysis for data enrichment available
What Satisfied Clients Say About Zurvey.io
“I love working with Zurvey.io, it instantly gives me a clear overview of our customers’ feedback. Neticle’s expert analyses save the Market Research Department significant amounts of time, since they give us sharp, definite recommendations about the areas we need to improve. We integrate these into our strategic decisions in order to further improve our customers’ shopping experience.”
.png?width=1920&height=510&name=Raiffeisen-Bank-International-logo-BW%20(1).png)
“As a CX leader, I thrive in collecting, analysing and extracting insights from customer feedback. Neticle, with their advanced technology and customer centricity, have been instrumentation in our efforts to harness the power of unsolicited (text) feedback – a source of insights that is continuously increasing in importance as we digitize our customer journeys.”

"Zurvey.io has an intuitive GUI and nice graph-type visualization of topics and sentiments that help better understand customer surveys and messages on a larger set of data, e.g correlating sentiments, name entities, locations, and verbs. It supports almost all European languages handles negations, double negations as well."


