3.1 Dashboard elements
Several dynamically changing graphs show the analysis of responses and respondents’ data in close to real time. The overview graphs display results based on all questions, but you can view each question’s results separately as well.
These are the available tabs on the dashboard:
- Summary: offers a general overview of the dataset, including information about the share of sentiment, recognised labels and the most important co-mentions.
- Labels: gives you a detailed overview of recognised entities such as topics, locations, brands and emotions.
- Relations: explores the deeper connections between different topics, including co-mentions and opinion correlations.
- Time series: visualises changes in sentiment and most frequently mentioned topics during the given period.
- Categories: provides aggregated statistics based on predefined categories from the uploaded dataset.
- Custom labels: shows statistics related to the formerly created custom labels and their occurrence in the uploaded dataset.
- Feed: includes the list of all analysed verbatims from the dataset. Every text unit contains a sentiment score, sentiment coloring and the list of recognised entities, providing a transparent view of text analysis methodology.
3.2 Filtering
Zurvey.io visualizes the results of processing on an interactive dashboard. The dashboard has rich filtering options to better reveal insights from huge datasets. You can filter data based on:
- label (always available)
- polarity (always available)
- custom label (if you have set any)
- date (if there is such a column)
- category (if there is such a column)
- number (if there is such a column)
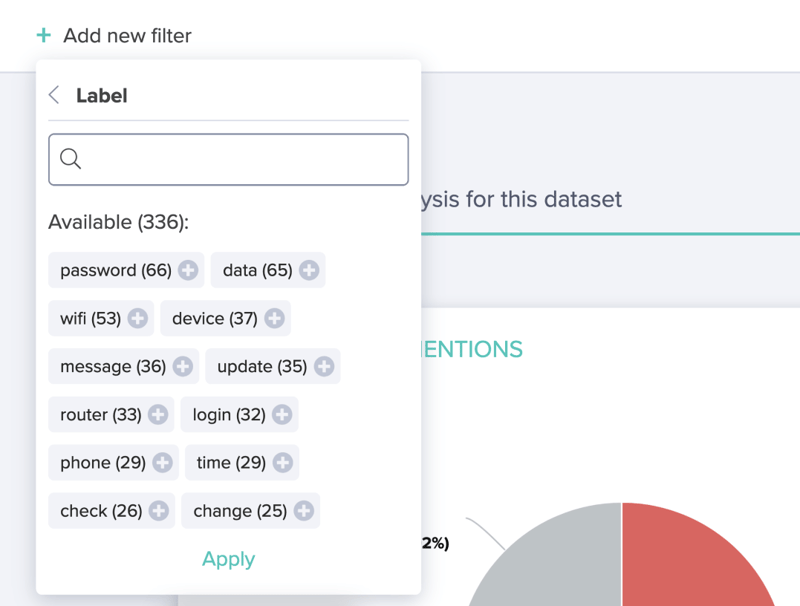
Several filter combinations can be applied with the OR/AND logic selectors. The preset categories of the uploaded dataset’s columns are listed in the left side menu as well. The current state of filtering, and the number of filtered verbatims from the whole dataset are always visible in the top left corner.
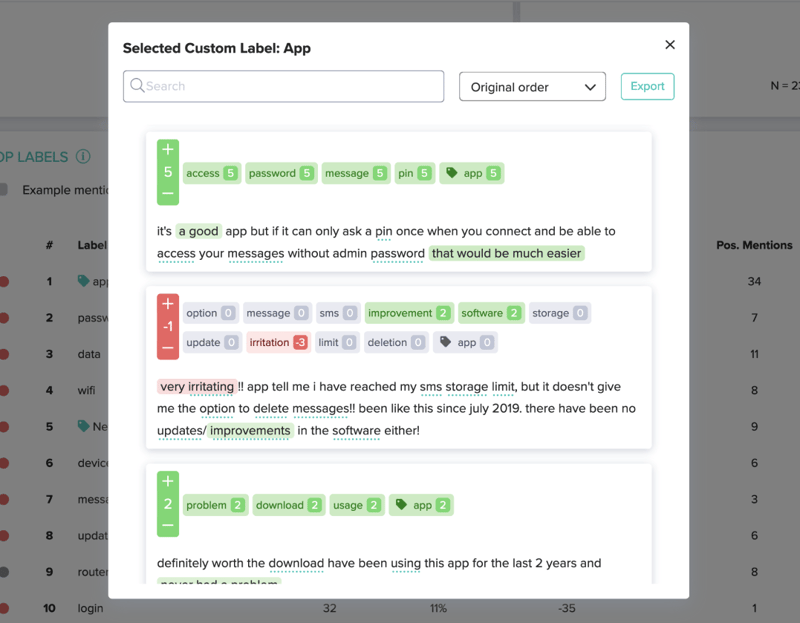
3.3 Drill down view
The user can drill down on almost any field on the dashboard, thus the exact mentions behind the figures can be revealed. In the drill down tab’s search field, order function and xlsx export are also available.
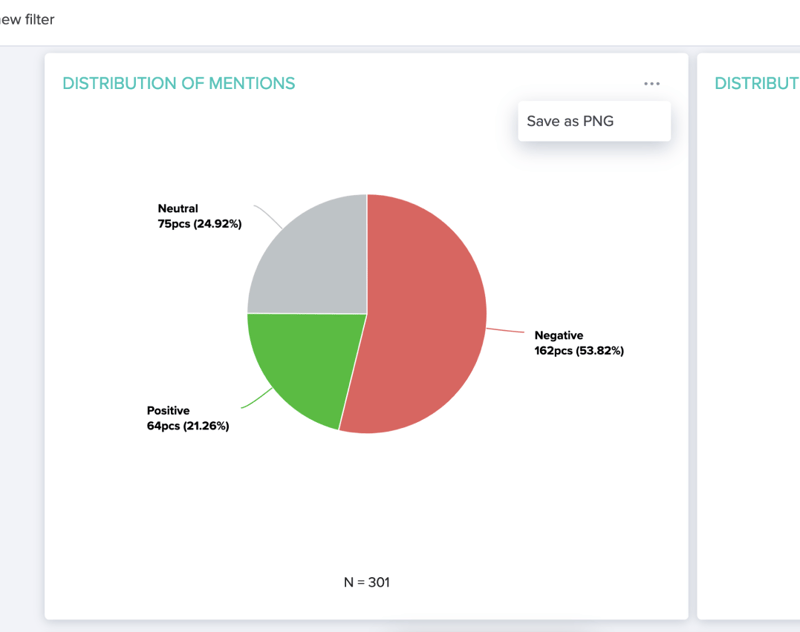
3.4 PNG export
All charts can be exported in PNG format, so you can easily use them in presentations or insert them into documents.
3.5 Excel (feedback analysis)
These are the tabs in the Excel export file:
- Summary: provides the most important statistics of the analysed dataset, including information about the share of sentiment, recognised labels, the most negative/positive verbatims and strongest correlations.
- Rows: a list of all uploaded verbatims enriched by text analysis metrics (sentiment score and category) and results, including recognized entities (topics, attributes, locations, brands, positive/negative phrases) and custom labels.
- Labels found: a list of all recognised labels in descending order, providing statistics about frequency aggregated opinion index, and the related negative and positive verbatims.
- Row label matrix: a rare matrix of all analysed verbatims and the recognised labels. Cross-filtering gives an opportunity to find verbatims that have specific labels, even in huge datasets.
- Associations: provides the list of most frequently co-mentioned topics and the related verbatims.
- Opinion correlations: a robust matrix of recognized labels and sentiment index values, which reveals correlation between labels and sentiment score, or any previously added numeric metadata (eg. NPS score).