Your regular analytical tasks have just become way easier: slice, dice and compare your data series however you need to with Zurvey.io’s new multiseries comparison feature.
In the world of customer experience, big data is our bread and butter, and we know that to navigate its depths, great analytical features are adamant, especially in CX platforms. The developers of Zurvey.io had all the CX professionals, data analysts and market researchers in mind when they created this new addition to the platform: the multiseries comparison.
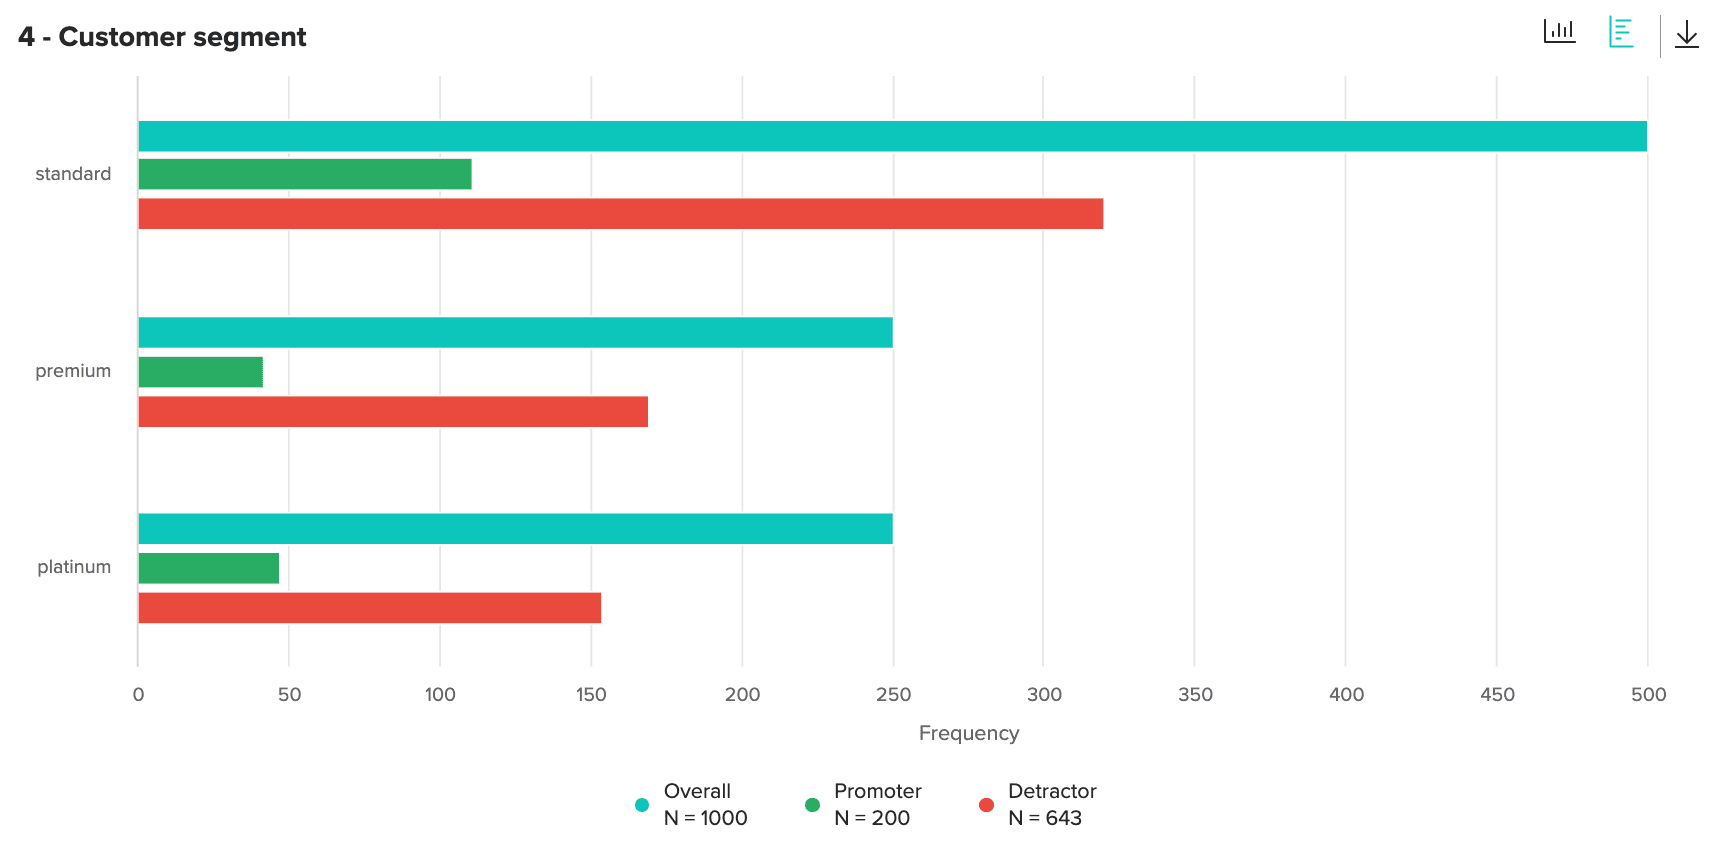
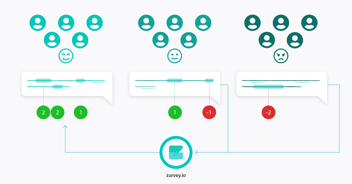
If you have huge datasets, the need to divide them into data series and make comparisons probably arises sooner rather than later. Zurvey.io now lets you see multiple defined data series in one chart to compare them – no need to export your data to Excel or to other third party BI tools. This feature is especially useful if you have rich metadata besides textual feedback, but it works with any kind of data suitable for segmentation.
How does it work?
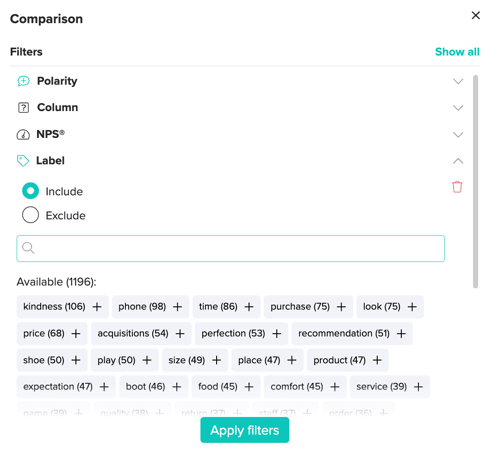
Find the Comparison button on the left panel and click on Add new data series to make the data series creator popup appear. Here you can define a data series using your current filter set, previous filter sets or create a new one from scratch using the usual filter selectors.
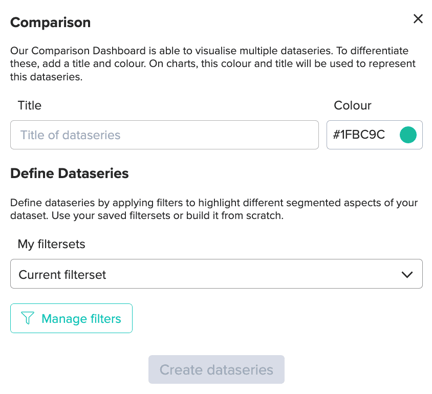
Give the data series a name and save it - the color can be modified as well to make it on-brand or for better differentiation. When you have defined the first data series, it appears in the left column list beside the automatically created Overall (No filters) one. Almost every chart has a comparison version on the dashboard – there are only a few exceptions such as the Mention graph or the Key driver chart, which cannot be visualized this way.
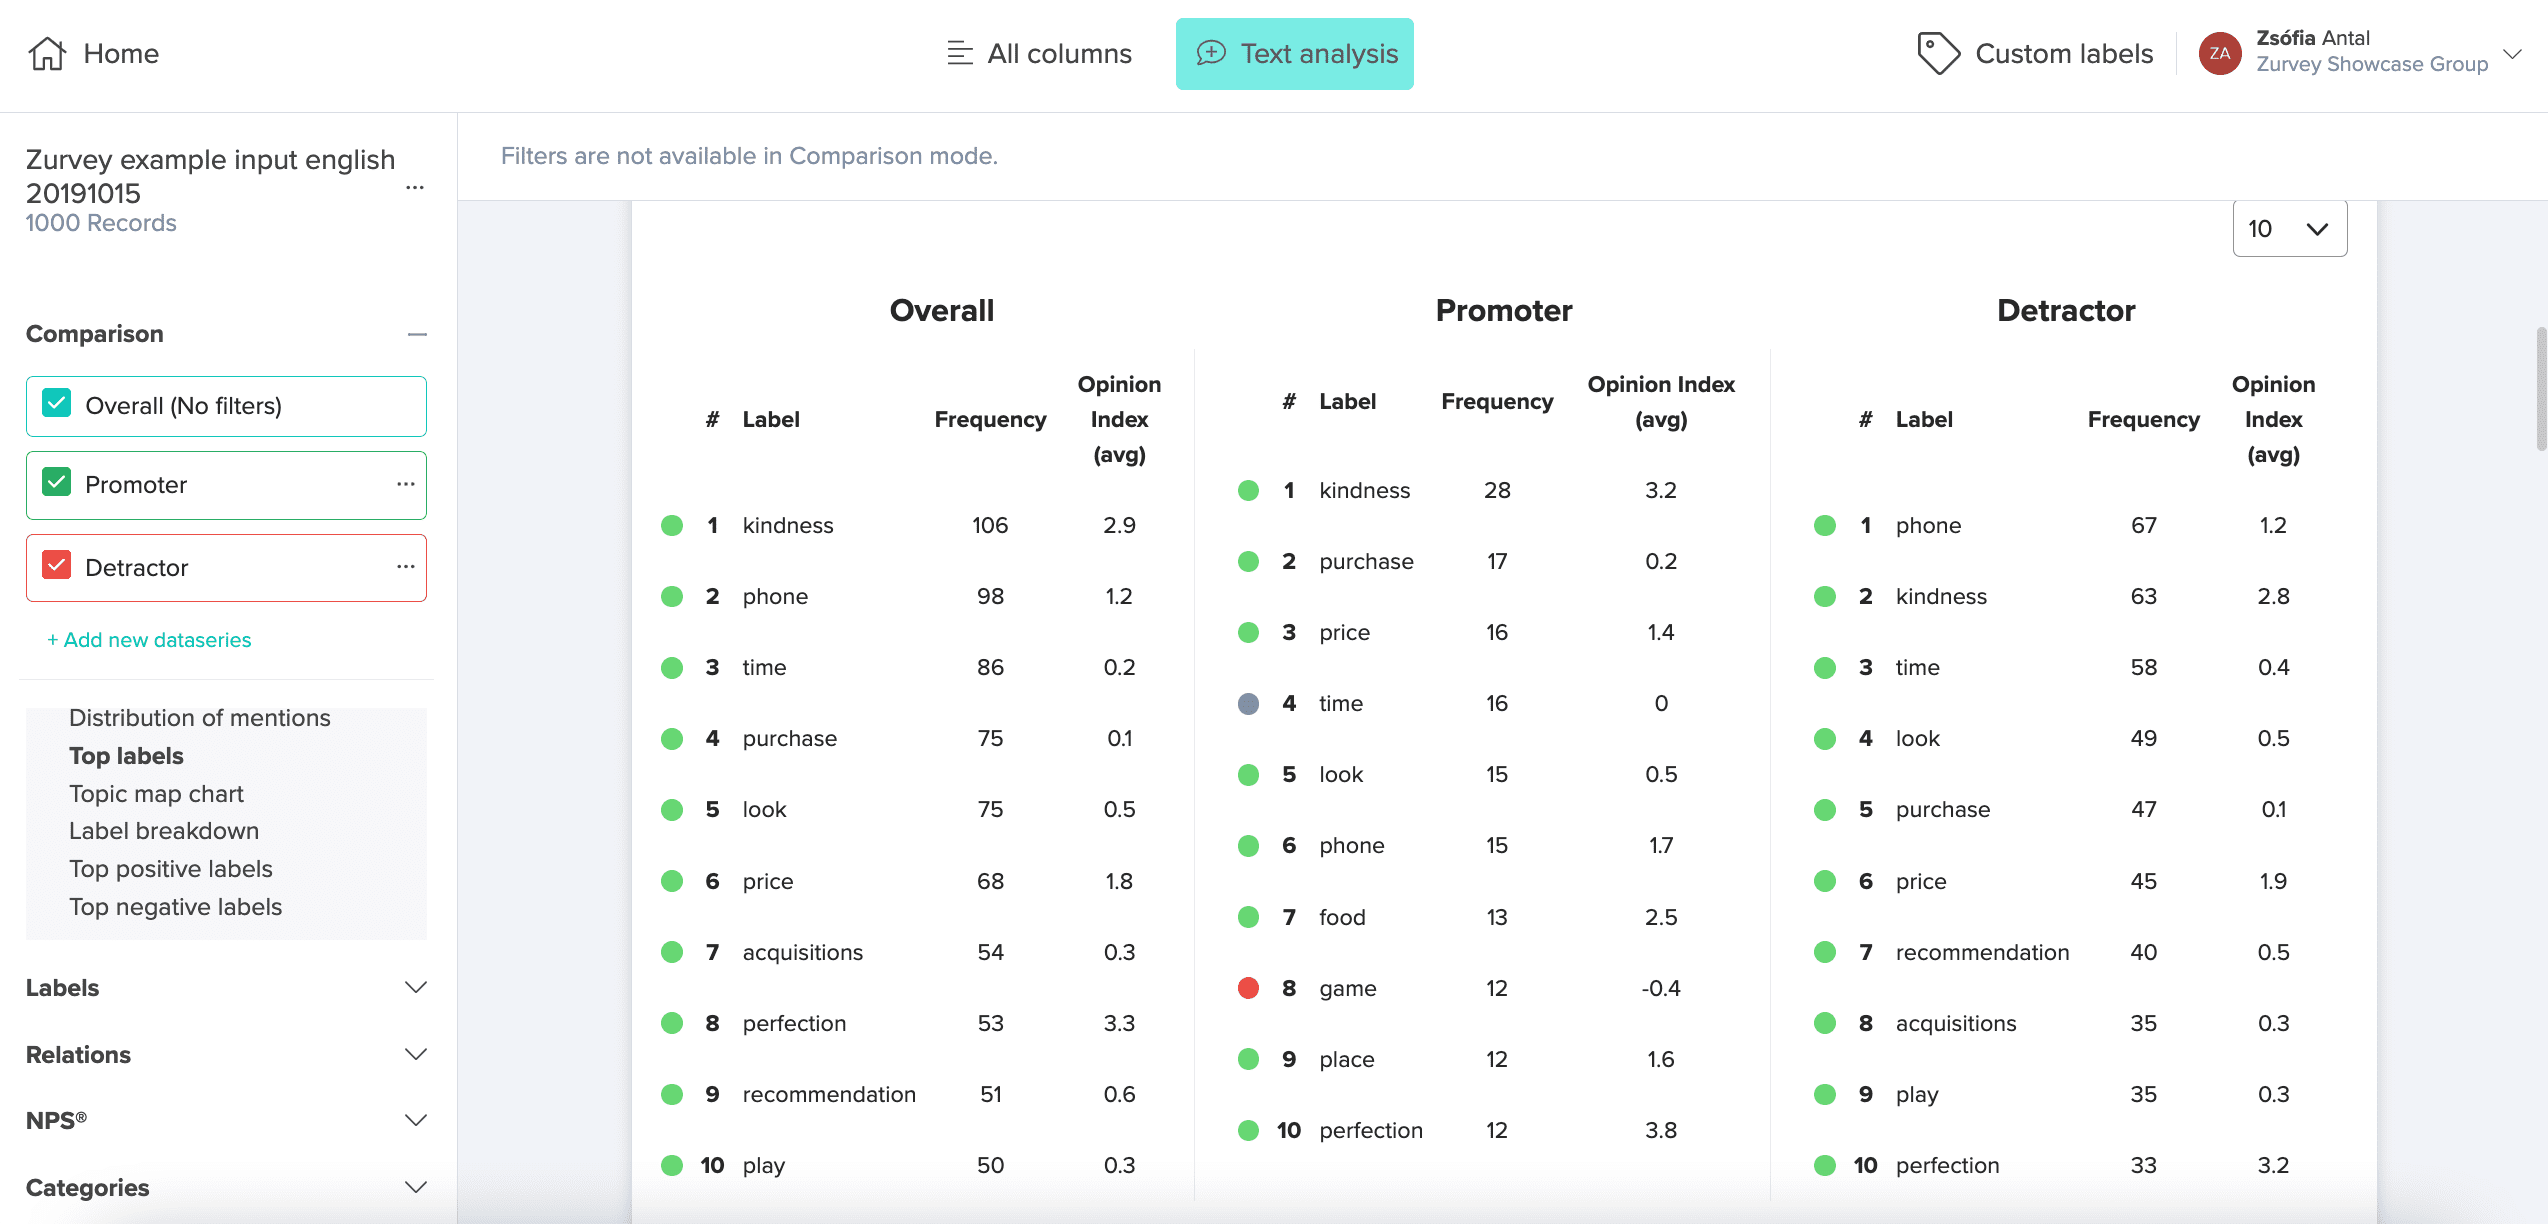
Any number of data series can be created, but no more than three can be active and visualized at the same time. To switch between data series, you can activate and deactivate them using the checkbox on the data series element. Like filter sets, defined data series are saved in the group too, so you can use them later.
The comparison feature is available on both the ‘All columns’ and the ‘Text Analysis’ tab. It means both quantitative metadata and qualitative text analysis results are comparable, but it works even if there’s no textual data in your dataset.
Try it – we think you’ll like it!
Now you know how to create your data series and compare them, but what are some of the best purposes to use them for? With the help of this feature, you could, for example:
- compare NPS® Detractors to Promoters or Passives;
- compare pain points of customers from rural and urban areas;
- compare opinions related to a mobile app before and after a new version is released.
There are myriads of other ways to benefit from this feature, and we’d love to hear your feedback on how you are utilizing it. Share your best analytical stories with us, we always learn the most from our users and clients.
Share:
.png?width=352&name=new_input_methods_Rajzta%CC%81bla%201%20(1).png)